Jobs monitor
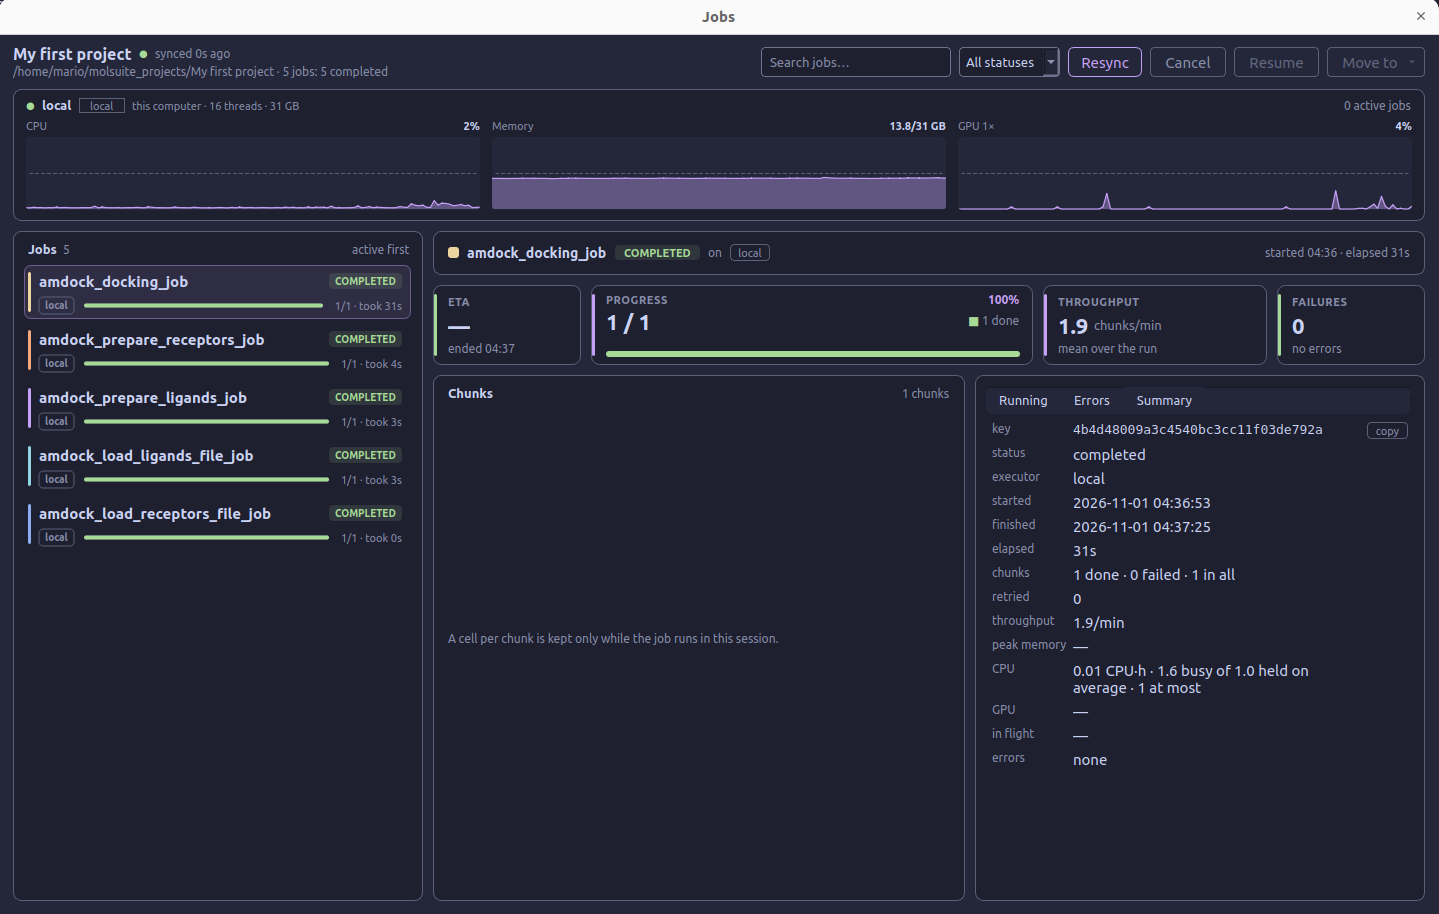
The Jobs monitor shows the background work submitted by the active project, including imports, molecule preparation, pocket prediction, clustering, QSAR, and docking. It opens in a separate window so you can inspect a run while continuing to use the project workspace.
1. Open the monitor
Select Jobs on the right side of the top toolbar, or click the jobs indicator in the status bar. Tools that provide a See details link can also open the monitor for you.
Opening the window focuses running work first, with waiting work as the fallback. An already selected running job stays selected. If filters would hide the active job, the monitor clears them to reveal it. You can then select another job to inspect its details.
Closing the window hides the monitor; jobs continue in the background. Reopen it from Jobs whenever you need to check progress.
2. Find a job
The header identifies the active project and summarizes its jobs by status. The list on the left puts active jobs first. Each entry shows the job name, status, executor, progress, and elapsed or estimated remaining time.
Use the controls above the list to narrow what is shown:
- Search jobs... searches job names, IDs, statuses, and executor names.
- All statuses filters the list to one of the statuses present in the project.
- Clicking a host card shows the jobs assigned to that host's executors.
- Clicking the executor name in a selected job's detail header filters the list to that executor.
- The host or executor filter chip clears that filter when clicked.
- Resync requests fresh job information and reloads the selected job's error details.
Search, status, and host or executor filters apply together. Clear the search and return to All statuses if you want to browse the full job list.
3. Read the job status
Select a job to display its details on the right. Its status indicates the stage it has reached:
- Waiting — Submitted but not yet running.
- Running — Work is being executed.
- Completed — The job has finished successfully.
- Completed with errors — The job finished but reported errors; inspect its failures before using the results.
- Failed — The job could not finish successfully.
- Canceled — Execution was stopped by a cancellation request.
- Interrupted — Execution stopped before the job completed.
The detail header also identifies the executor and shows start and elapsed times.
4. Follow progress and resource use
The host cards at the top show CPU, memory, and, when available, GPU activity for the local computer and hosts used by active executors. These charts describe the host as a whole. Queue login nodes are identified separately and do not show resource charts.
For the selected job, the detail panel provides:
- ETA — An estimate of the remaining time based on recent throughput. It shows calculating until enough information is available.
- Progress — Completed work and the distribution of pending, running, done, and failed chunks.
- Throughput — The rate at which chunks are processed.
- Failures — Failed chunks and reported job errors.
A chunk is a unit of work submitted by a tool. Depending on the operation and batch size, it may contain one molecule or a batch, so the chunk count is not necessarily the molecule count.
The Chunks panel shows individual chunk states when those data are available for the current session. After reopening an older run, the totals and summary can still be available even when the individual cells are not.
5. Inspect running tasks and errors
Running
The Running tab lists tasks currently in progress, with their input, host, attempt number, elapsed time, and reported progress. When enough tasks are present, the monitor highlights those taking substantially longer than the median task time.
Errors
The Errors tab groups failures by their message. Select a group to read its recorded error or traceback below the list. Hover over a group to see examples of affected inputs and their attempt numbers. If only part of a large failure list has been read, the panel reports the remaining count.
Use these details to identify the input or missing requirement that needs attention before submitting more work. Resync reloads the error details if you need an updated view.
Summary
The Summary tab collects the job ID, status, executor, timestamps, elapsed time, chunk counts, retries, throughput, and available memory and CPU/GPU usage measurements. Select copy beside the job key to copy its ID when reporting a problem.
6. Cancel, resume, or move a job
Select a job before using the actions in the header:
- Cancel requests cancellation of an active job. The header reports whether the request was accepted or failed.
- Resume continues a canceled or interrupted job on the executor where it ran. This button is available for those stopped states.
- Move to lists the available destination executors for a job that can be continued. Moving an active job stops it first, then continues it on the selected executor. If continuation is unavailable, the menu reports that the job cannot be continued.
Action availability depends on the job's state and execution context. If an action fails, read the message beside the project title. Use the application's Executors window to start or stop executors.
7. Return to the results
When a job finishes, return to the tool or result view that submitted it: for example, Docking Results, QSAR Analysis, or Clusters. For preparation and import jobs, inspect the updated records in the molecule catalogs.