Diversity
Diversity groups ligands by molecular similarity and lets you choose representatives from the resulting clusters. Open it from the left tool rail to configure a run. Completed runs are reviewed in the separate Clusters view, opened from the top catalog or through Show clusters.
Clustering records a result without automatically changing the global ligand selection or excluding compounds. Those actions are available after you review the clusters.
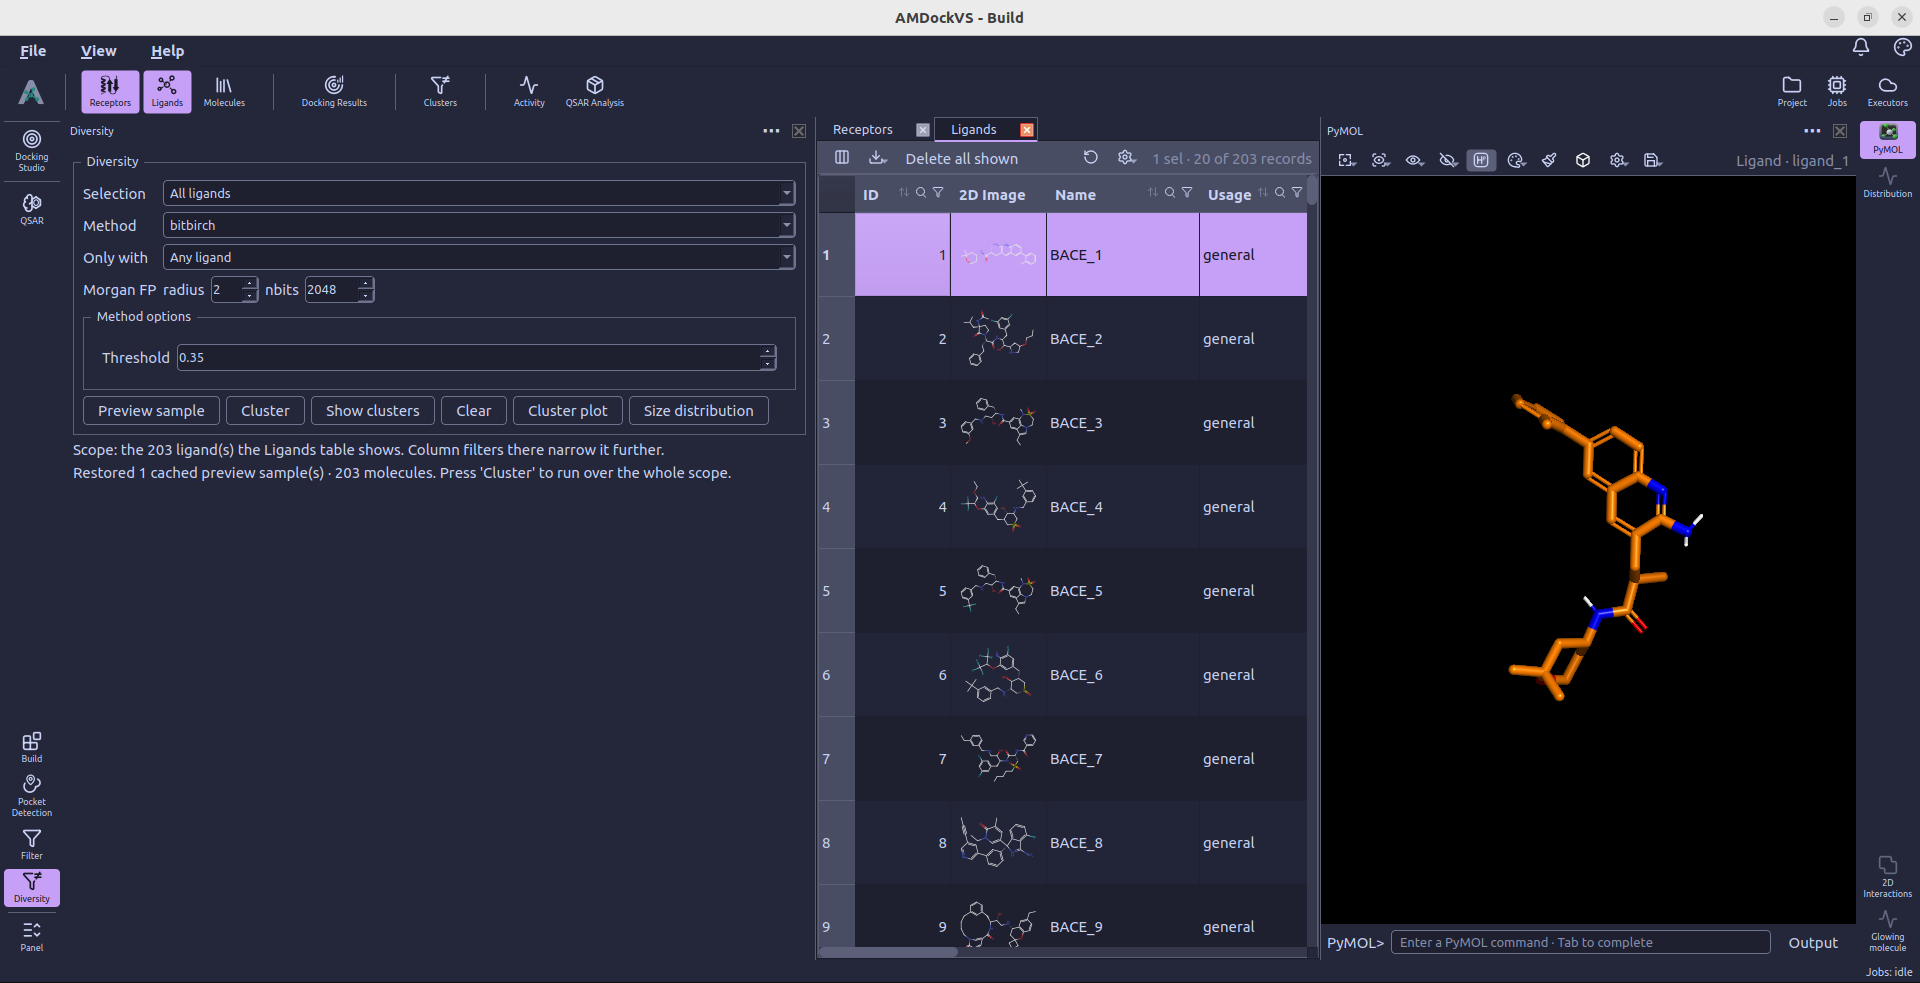
1. Choose the ligands
Use Selection to choose All ligands, Current selection, a usage class (General, Reference, or General + Reference), or a saved set. When the project has a sharded screening library, Screening library (shards) is also available.
Current selection uses the global ligand selection made with right-click → Select in a ligand table. Other choices use their own scope and ignore that selection. For project rows, the Ligands table shows the chosen scope while the tool is open, and its column filters can narrow it further.
Only with can restrict project ligands to those with a value for an activity endpoint. Leave it at Any ligand when activity measurements are not required for your clustering run.
2. Configure similarity and clustering
Choose a Method (currently BitBIRCH) and set its Threshold in Method options. Higher thresholds produce tighter clusters and generally retain more clusters. Some methods also expose a batch-size control.
Under Morgan FP, set the fingerprint radius and nbits. The initial values are radius 2 and 2048 bits. The fingerprint settings affect similarity, so evaluate the clustering threshold together with those settings.
3. Preview a sample
Preview sample clusters a random sample to help you adjust the method and threshold before submitting a full run. It displays a two-dimensional projection in the Distribution panel. Repeated previews accumulate samples; once all molecules in the scope have been previewed, another click restores the existing plot. Changing the method, threshold, or other method options starts a fresh preview with the new settings. Clear resets the accumulated preview when you want to start again with the same settings.
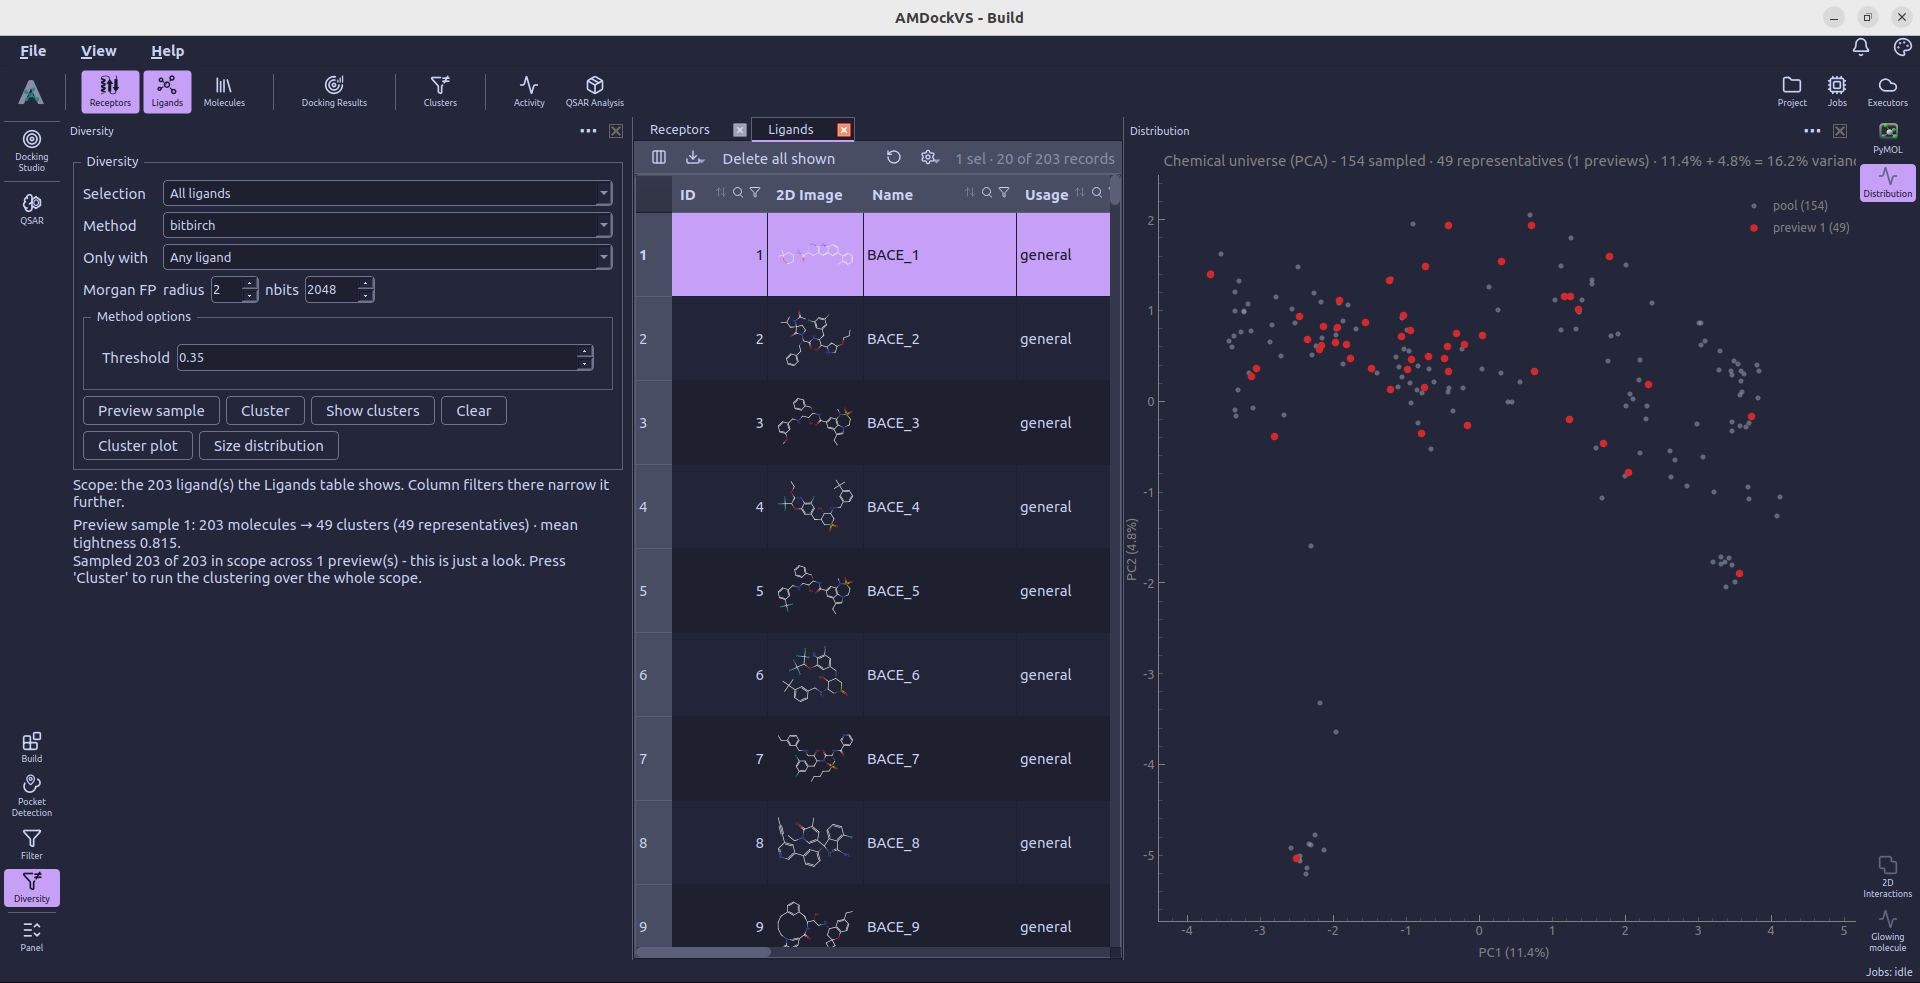
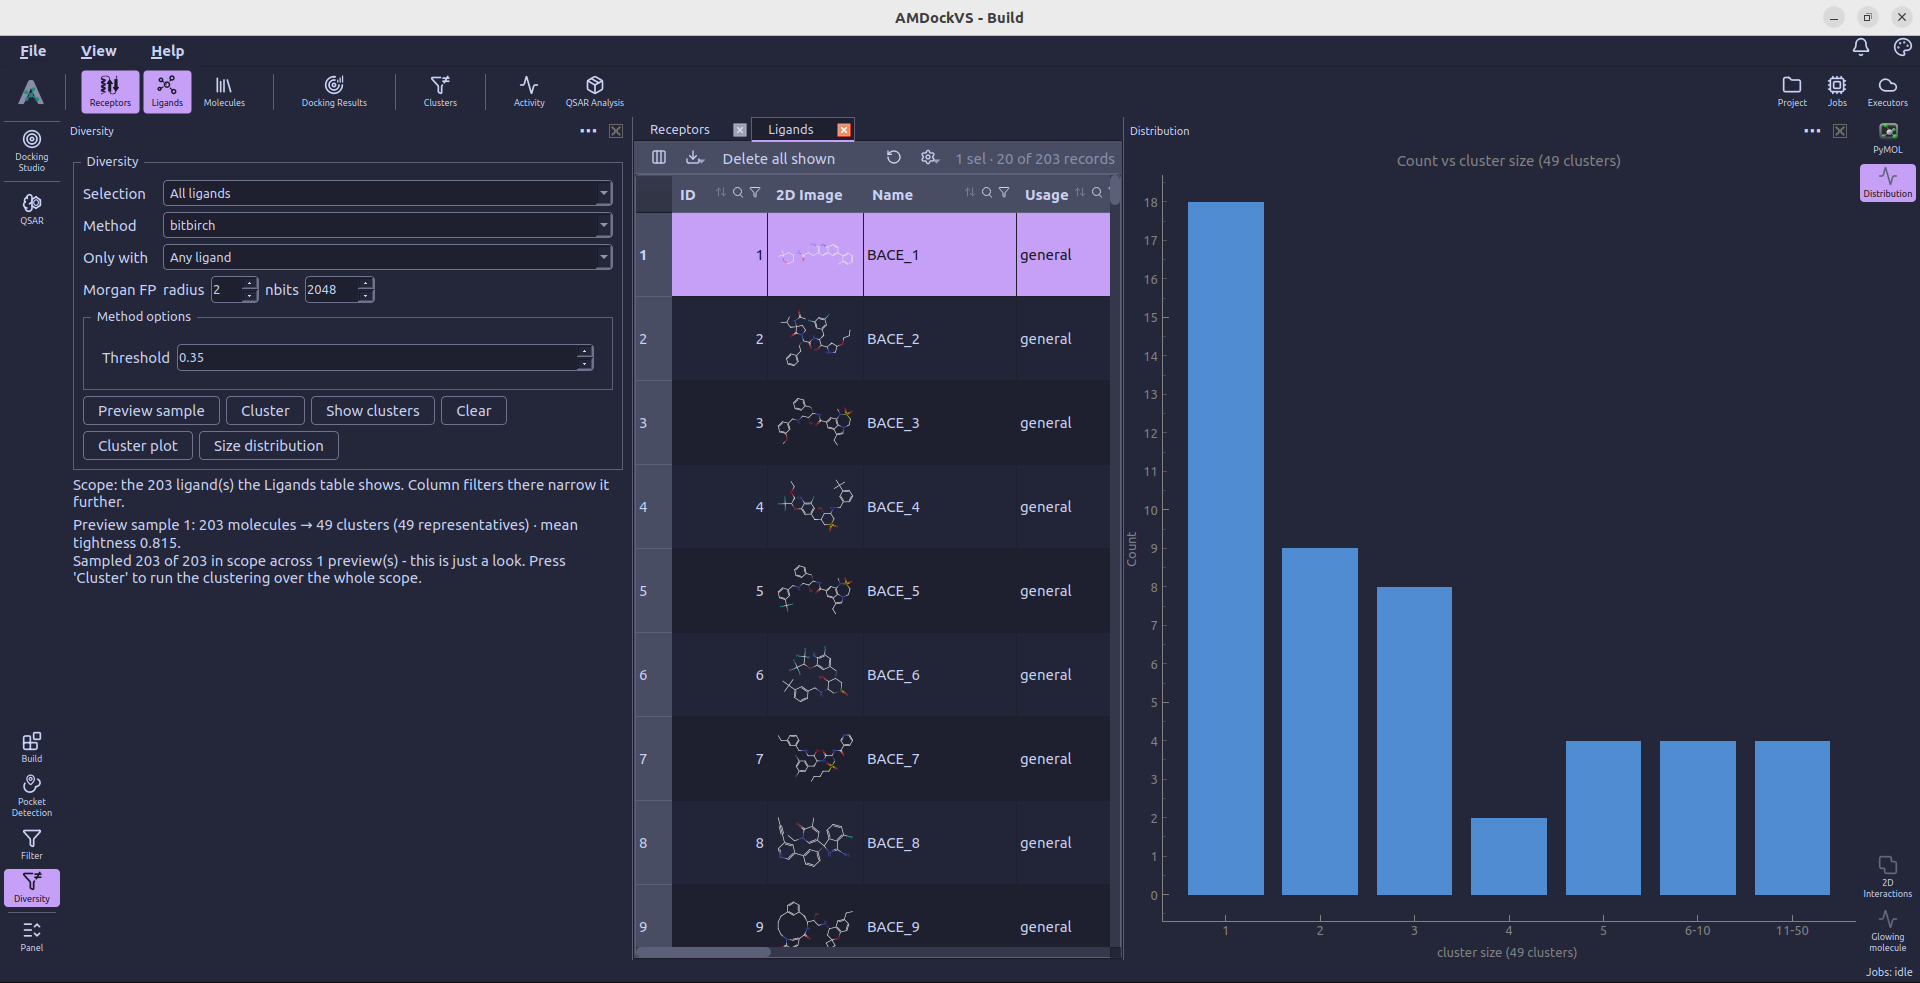
Size distribution replaces the scatter plot with a histogram of compounds per cluster. Use it to see whether the preview contains many singletons or a few large clusters. Select Cluster plot to return to the accumulated scatter plot without taking another sample or clustering again. Previewing does not change molecule selection or exclusion state, and it does not replace a full clustering run.
4. Cluster the full scope
Select Cluster. AMDockVS counts the molecules and suggests a CPU count; accept or adjust that count to submit the clustering job. Follow the job in the Jobs monitor. The completed run opens in Clusters, where its scope, clusters, and representative molecules can be reviewed.
For a sharded screening library, clustering works on the library in its shards; its representatives become project ligand rows.
5. Choose representatives
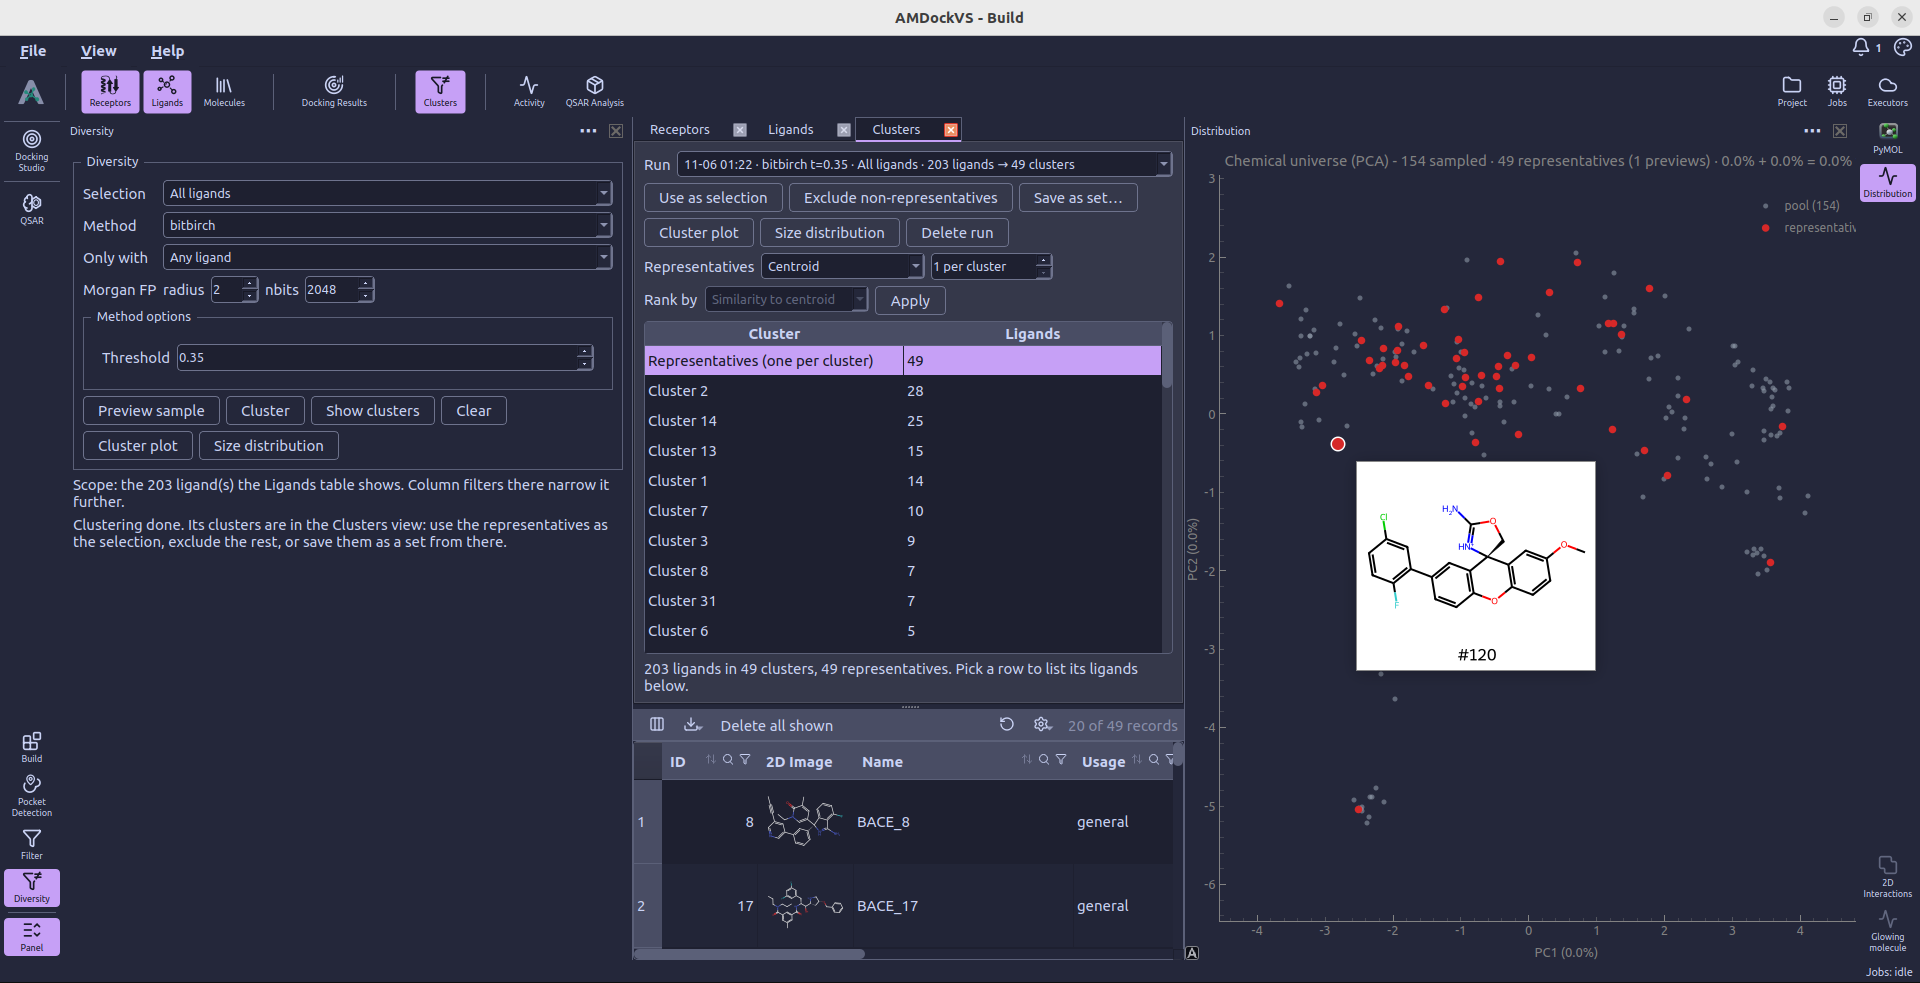
In Clusters, select a run and review the representative row or an individual cluster to see its ligands. The Representatives controls let you change the selection strategy:
- Centroid chooses members closest to the cluster centroid.
- Medoid chooses members most similar, on average, to the rest of the cluster.
- Extremes chooses members spanning the low, middle, and high values of the selected ranking.
- Quartiles samples across quartiles of that ranking.
- Proportional allocates representatives according to cluster size.
For strategies that use Rank by, choose similarity to the centroid or an available activity endpoint. Select Apply to update the representatives for that run.
6. Use the result
- Use as selection makes the ligands currently listed in the result view the global ligand selection, ready for tools such as Docking Studio.
- Save as set... stores the run's representatives as a named ligand set.
- Exclude non-representatives marks the other ligands of the run as excluded while retaining their records in the project.
- Size distribution plots the cluster-size distribution for the run.
- Cluster plot returns to the run's scatter plot, keeping the selected cluster and using the existing results without rerunning clustering.
- Delete run removes the saved clustering run; it is separate from excluding molecules.
If the result is too large for a table selection, save the representatives as a set or use the exclusion action instead.
Continue with Docking Studio to dock a selected subset, or QSAR to model ligands with activity measurements.